
From Scarcity to Abundance: LNG, Oil, and the Strategic Outlook for Floaters to 2035
For most of the last decade, the energy narrative was dominated by underinvestment, constrained supply, and chronic fears of shortages. But as we approach the 2030–2035 horizon, the story is shifting: both LNG and oil markets are moving toward structural oversupply, not because demand collapses, but because supply capacity is expanding faster than consumption. In this environment, floating production systems — FPSOs and FLNG units — evolve from niche solutions into strategic infrastructure enabling operators to navigate cycles of abundance.
LNG: The Largest Capacity Expansion in History
The global LNG market is entering its most aggressive expansion phase ever. By 2030, global LNG liquefaction capacity is expected to reach ~700 Mtpa, representing a 40–45% increase from 2024 levels. This surge is driven by the U.S., Qatar, Africa, and new entrants accelerating project delivery.
More than 170 Mtpa of new LNG supply will enter the market by 2030, while U.S. capacity may double, and Qatar pushes ahead with its North Field expansion.
Yet LNG demand growth, although steady, is insufficient to absorb the entire surge. This dynamic doesn’t destroy demand — it changes price signals, creating opportunity.
Turning Oversupply Into Opportunity
Oversupply does not eliminate demand — it reshapes price signals and opens new absorption channels for LNG. Two sectors stand out as the strongest demand engines through 2035: marine fuel and power generation. Critically, many power systems still lean heavily on coal: globally, coal remains the single largest power source at ~34% of generation; China’s coal share exceeds 50%; India’s electricity is still ~78% fossil‑based with coal dominant; and Germany, while rapidly decarbonising, still generated ~21% from coal in 2025. In short, large markets either rely substantially on coal today or are only recently diverging from it — and fuel‑switching from coal to LNG is one of the few immediately scalable ways to cut system‑wide emissions while renewables ramp.
🛳 LNG as Marine Fuel
LNG continues to gain momentum as a marine fuel due to tightening emissions rules (IMO, FuelEU Maritime 2025) and improving cost competitiveness. Industry assessments indicate LNG bunkering demand will reach ~4 million tonnes in 2025 and is expected to double by 2030 as more dual‑fuel vessels enter operation. Aligning these developments with the EIA’s long‑term projection of rising LNG export flows — from 4.4 Tcf in 2024 to 9.8 Tcf by 2037 — shows continued availability and pricing that favor LNG adoption in shipping. A realistic, EIA‑consistent outlook has marine LNG reaching ~12–14 Mtpa by 2035, effectively tripling from 2025 levels.
🔌 Coal‑to‑Gas Switching in Power Generation
The IEA projects global natural gas demand to rise ~1.5% annually to 2030 (≈ +380 bcm), with power as a primary driver. Using typical scenario splits in which 35–40% of incremental gas demand comes from the power sector, this implies ~133–152 bcm more gas for power by 2030 — equivalent to ~97–111 Mt of LNG (1 bcm ≈ 0.73 Mt). Assuming LNG supplies 20–25% of this incremental power load as pipelines lag, LNG‑for‑power could rise by ~20–30 Mtpa by 2035.
From an emissions standpoint, the EIA finds coal‑fired generation emits ~2,257 lb CO₂/MWh versus ~976 lb CO₂/MWh for natural‑gas‑fired power — less than half per unit of electricity — with additional reductions arising from higher efficiency in combined‑cycle gas turbines. That is why systems that substitute LNG‑to‑power for unabated coal can deliver material, near‑term CO₂ cuts while renewable build‑out accelerates.
Taken together, these two sectors — marine fuel and power — could collectively absorb ~30–44 Mtpa of new LNG demand by 2035 and, crucially, lower total emissions in coal‑reliant systems as LNG displaces unabated coal in the merit order.
Oil Markets: Resilient Supply and New Entrants
Oil markets exhibit a parallel risk of oversupply through the 2030s. U.S. tight oil remains responsive, OPEC+ retains spare capacity, and new players — most notably Venezuela — are re‑emerging.
Venezuela holds the world’s largest proven oil reserves, and regulatory changes in 2025–2026 have allowed operators like Shell to resume offshore gas and oil activities in the region. These incremental barrels could place downward pressure on Brent in the late 2020s and early 2030s if demand growth remains moderate.
Offshore Frontiers Poised for Floating Development
With markets entering a phase of abundance, offshore basins offering rapid monetization and lower fixed‑infrastructure requirements are attracting renewed attention.
Regions well‑positioned for FPSO/FLNG deployment include:
Venezuela & Caribbean offshore – ideal for early‑stage monetization.
Suriname / Guyana Basin – FPSOs and future FLNG potential.
Namibia (Orange Basin) – rapid deepwater discoveries.
Mozambique (Rovuma Basin) – already proven by Coral South FLNG.
Tanzania & Argentina – candidates for scalable FLNG solutions.
Floaters enable fast‑track development, lower capital exposure, and deployment agility in politically or logistically complex regions.
Floaters in an Age of Abundance: A Strategic Shift
As LNG and oil supply shift from scarcity to abundance, floating production systems become essential tools for navigating volatility:
Faster time‑to‑first‑oil/gas
Lower upfront infrastructure risk
Redeployability across basins
Ability to align with short‑cycle price movements
But understanding the future role of floaters requires quantifying how many units the world will actually need.
⭐ How Many Floaters Could Be Deployed by 2035?
The next decade will likely mark the largest expansion of the floating production fleet in history, driven by project backlogs, deepwater investment, and the renaissance of FLNG economics.
FPSOs: Strongest Growth in Deepwater Regions
Where the fleet stands today (2024)
169 operational FPSOs
14 idle units available for redeployment
33 FPSOs under construction
This forms a base of 216 units either producing or entering service.
Pipeline of future FPSO projects
GlobalData identifies 66 planned FPSO projects between 2022 and 2027, with Brazil, Guyana, and West Africa leading the pipeline.
Meanwhile, Brazil alone hosts 11 of the 15 FPSOs under construction for the ultra‑deepwater Búzios field.
South America now represents ~45% of all new FPSO deployment, confirming a long‑term deepwater supercycle.
Projected FPSO fleet by 2035
Taking into account:
33 units in construction,
66 planned projects,
expected annual FIDs in emerging deepwater regions,
the world is on track to add 90–110 new FPSOs by 2035.
The projected global FPSO fleet by 2035 will be around ~260–280 units. This will mark the largest FPSO fleet ever assembled.
FLNG: The Fastest‑Growing Floating Segment
FLNG capacity expansion (2024–2035)
Rystad Energy forecasts global FLNG capacity rising from 14.1 Mtpa (2024) to:
42 Mtpa by 2030,
55 Mtpa by 2035, a four‑fold increase driven by reliability gains and declining capex.
Implications for FLNG unit count
Given typical FLNG plant sizes (2–5+ Mtpa), reaching 55 Mtpa implies the start-up of around 20 new operating FLNG units by 2035 (vs. 8 today)
Thus, 10-15 new FLNG units are likely to be delivered between 2024 and 2035.
Falling project costs accelerate this trend:
Newbuild FLNG: $1,054–$1,134/tonne
Conversion-based FLNG: $500–$640/tonne
FLNG momentum is taking advantage of the rapid construction schedules (3 years vs 4.5 years onshore), especially in Africa, Asia-Pacific, and the U.S. Gulf Coast.
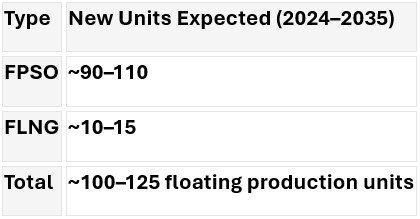
Combined Outlook: Total Floaters Added by 2035
This represents a historic expansion, reflecting both market abundance and capital reallocation toward fast‑cycle offshore solutions.
Looking Ahead to 2035: Abundance, Optionality, and Strategic Floaters
The 2030–2035 horizon will be defined not by resource scarcity, but by how effectively operators manage abundance.
By 2035 the market will feature:
Near‑record ~700 Mtpa LNG capacity
Oil markets influenced by resilient supply and new entrants
260–280 FPSOs and around 20 FLNG units operating globally
New deployment clusters across Africa, South America, and frontier basins with over 100 floaters expected
Floaters functioning as strategic, redeployable infrastructure
In this environment, FPSOs and FLNG units are no longer stopgaps — they are strategic assets that grant agility, mitigate capital risk, and help operators capture value in a world where supply is abundant and flexibility is king.
References (APA)
Deloitte. (2025). 2025 oil and gas industry outlook: Navigating supply expansion and market uncertainty. Deloitte Insights. https://www2.deloitte.com
International Energy Agency. (2024). Gas market report 2024. IEA Publications. https://www.iea.org
Reuters. (2026, February 19). Shell says U.S. general license allows progress in Venezuela exploration. Reuters. https://www.reuters.com
Reuters. (2025, October 2). Eni takes final investment decision on second floating LNG unit offshore Mozambique. Reuters. https://www.reuters.com
S&P Global Commodity Insights. (2024). Global gas liquefaction capacity likely to reach 700 million mt/year by 2030. S&P Global. https://www.spglobal.com
Shell. (2025). Shell LNG outlook 2025. Shell Global. https://www.shell.com
OilPrice.com. (2025). After years of buybacks, big oil is drilling again. https://oilprice.com
World Ports Organization. (2025, October 5). LNG demand for marine fuel set to skyrocket by 2030. [Coal and N...Generation]
U.S. Energy Information Administration (EIA). (2025, July 29). AEO2025: Eastern U.S. natural gas increasingly meets LNG‑fueled demand growth. [powerprogress.com]
International Energy Agency (IEA). (2025, October 27). Coming surge in LNG production is set to reshape global gas markets. [lowcarbonpower.org]
McKinsey & Company. (2019). Global gas & LNG outlook to 2035. [eia.gov]
ENGIE Resources. (2025, January 27). EIA 2025 Natural Gas Outlook. [ourworldindata.org]
World Ports Organization. (2025, June 13). US EIA’s short‑term outlook finds natural gas demand outpacing supply. [drishtiias.com]
Ember. (2025). Global Electricity Review 2025. [iea.blob.c...indows.net]
Low‑Carbon Power Data. (2026). Electricity mix in China 2024/25. [mckinsey.com]
Ember. (2025). India Electricity Review. [rystadenergy.com]
Ember. (2026, February 10). Germany Electricity Profile 2025. [meti.go.jp]
U.S. Energy Information Administration (EIA). (2021, June 9). Electric power sector CO₂ emissions drop as generation mix shifts from coal to natural gas. [marketrese...future.com]