
NH3 FPSOs: A New Frontier in Offshore Energy
Floating ammonia FPSOs are emerging as a bold new tool in the offshore energy transition—promising to deliver green or blue ammonia directly at sea, and potentially reshaping global hydrogen logistics. But how do these floating plants actually work, and what makes them so different from the oil FPSOs and FLNGs we know?
In this first article of our series, we break down the technical and energy fundamentals of ammonia FPSOs, highlighting the unique challenges and opportunities of this next-generation floater.
Green vs. Blue Ammonia FPSOs
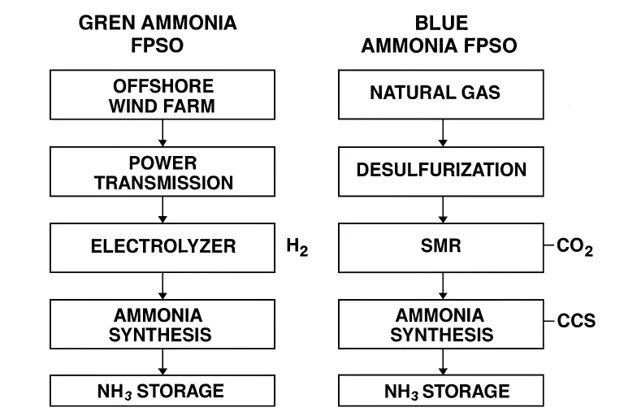
Green Ammonia FPSO:
Produces ammonia using hydrogen from electrolysis powered by renewable energy (wind, solar, wave) or nuclear energy.
No onboard power generation: electricity is supplied from offshore renewable sources (e.g., floating wind farms) via subsea cables.
Requires large electrical distribution systems and desalination units for electrolysis.
No direct CO₂ emissions during production.
Blue Ammonia FPSO:
Uses natural gas as feedstock for hydrogen production via steam methane reforming (SMR).
Could be both upstream (if connected directly to gas wells) or midstream (if connected to onshore pipeline or FPSO)
Equipped with Carbon Capture and Storage (CCS) to mitigate CO₂ emissions from the process and gas turbines.
Could be connected to gas pileline from shore or positioned near oil FPSOs to utilize associated gas that would otherwise be flared or reinjected.
Key Differences from Traditional FPSOs
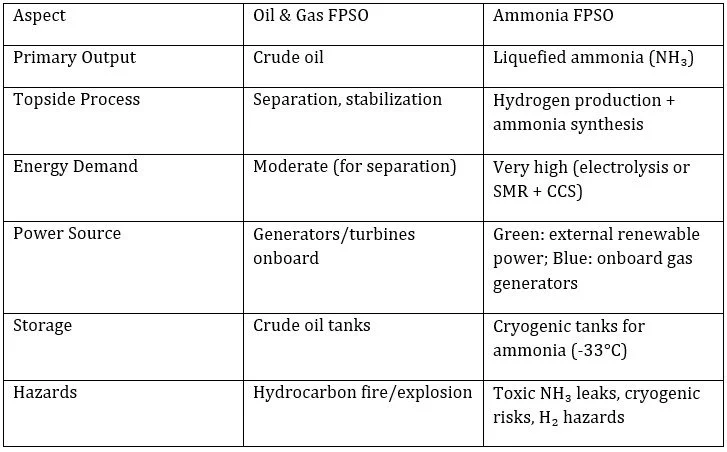
New Risks and Challenges
1. Toxicity and Corrosion: Ammonia is highly toxic and corrosive, requiring specialized materials and leak detection systems.
2. Cryogenic Storage: Liquefied ammonia must be stored at low temperatures, introducing thermal stress and insulation challenges.
3. Hydrogen Handling: Hydrogen production and compression increase explosion risk.
4. Process Complexity: Integration of electrolysis or SMR with CCS adds operational and maintenance complexity.
5. Emergency Response: Ammonia leaks require different mitigation strategies compared to hydrocarbons (e.g., water curtains, PPE for NH₃ exposure).
Block Flow Diagram
The diagram below illustrates the process flow for both Green and Blue Ammonia FPSOs.
Industry Concepts and Capacities: Leading Contractors in Ammonia FPSOs
Blue Ammonia FPSOs:
Samsung Heavy Industries (SHI): 'Samsung Ammonia Blue' concept, 1.2 million tonnes per annum (MTPA) production capacity.
SBM Offshore: Blue Ammonia FPSO concept with CCS, capacity not disclosed yet.
MODEC & Toyo Engineering: Blue Ammonia FPSO using associated gas from nearby oil FPSOs, with CCS.
Green Ammonia FPSOs:
Yinson Green Ammonia FPSO Concept: ~230 MW 165.000 t/year
H2Carrier P2XFloater™: ~100 MW electrolysis, producing 50,000–100,000 t/year.
Wison + H2Carrier: Concept for 500 MW electrolysis, targeting 0.25–0.5 MTPA.
Trend Highlights:
Blue ammonia dominates early projects.
Green ammonia FPSOs face challenges with renewable intermittency.
Hybrid concepts are being studied.
Classification societies like ABS are actively granting AiPs.
Energy Comparison: Oil FPSO vs Ammonia FPSO and FLNG
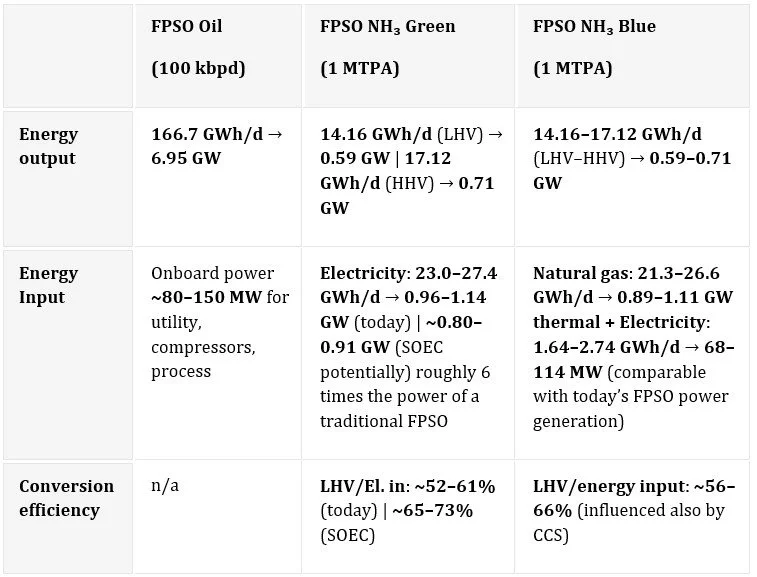
When comparing a traditional oil FPSO producing 100,000 barrels per day with an ammonia FPSO producing 1 MTPA (≈ 2,740 t/day), the energy gap is striking:
Oil FPSO (100 kbpd): Energy in product: ~166,700 MWh/day (≈ 6.95 GW continuous).
Ammonia FPSO (1 MTPA): Energy in product (LHV): ~14,150 MWh/day (≈ 0.59 GW).
A 1 MTPA ammonia FPSO delivers only about one-tenth of the energy of a 100 kbpd oil FPSO. To match the energy output of a single large oil FPSO, you would need around 12 ammonia FPSOs of 1 MTPA each.
Energy Inputs and Efficiency:
Despite handling a much larger energy output, an oil FPSO requires typically tens to hundreds of MW for compression, injection, and separation (case studies show multiple LM2500+G4 turbines, with 70–80% of emissions linked to turbines).
Ammonia FPSO are, on the other hand, a much energy hungrier asset:
Green Ammonia FPSO: Power demand ~0.96–1.14 GW (8.4–10 MWh per ton NH₃). Efficiency (LHV basis): ~52–61% today; up to 65–73% with advanced SOEC.
Blue Ammonia FPSO: Thermal input ~0.9–1.1 GW (natural gas). Electrical input: 70–110 MW. Efficiency (LHV basis): ~56–66% with CCS.
The comparison highlights that a 1 MTPA green NH₃ FPSO is, electrically, a GW-class asset.
This explains why green FPSO concepts tend to avoid onboard power generation and instead connect to offshore wind farms or grids.
How Does a green ammonia FPSO Compare to FLNG?
After all these efficiency analyses, we could ask why we should keep using LNG instead of reforming in ammonia.
FLNG liquefaction energy intensity: Typical LNG liquefaction requires ~280 kWh per ton of LNG (≈ 1.0 GJ/t), which is about 5% of the gas energy content.
Blue Ammonia FPSO: Requires 28–35 GJ/t of natural gas feedstock (plus CCS), which is ~30× higher energy input per ton of product compared to LNG liquefaction, because ammonia synthesis is a chemical conversion, not just a phase change.
FLNG is far more energy-efficient in terms of processing because it only liquefies gas, while blue ammonia FPSOs must reform methane into hydrogen, remove CO₂, and synthesize NH₃, making them much more energy-intensive.
Sizing for Equal Energy Output
To match the energy output of a 100,000 bbl/day oil FPSO (~166.7 GWh/day):
Blue Ammonia FPSO:
~12 MTPA NH₃
23–29 million Sm³/day natural gas feed
0.8–1.35 GW electric auxiliaries
Note: This electric demand is above what can be generated onboard. The main electrical loads are:
• CO₂ capture and compression (CCS trains)
• Ammonia refrigeration and large synthesis/compression trains
Green Ammonia FPSO:
~12 MTPA NH₃
11–14 GW electric input (today) or 9–11 GW (SOEC optimized)
FLNG:
~3.9–4.5 MTPA LNG
125–145 MW liquefaction power
Conclusion
While ammonia FPSOs represent a promising innovation for offshore decarbonization, their current limitations in energy density and conversion efficiency pose significant challenges compared to traditional oil FPSOs and FLNG units.
For example, a 1 MTPA ammonia FPSO delivers only about one-tenth the energy of a 100,000 bbl/day oil FPSO—meaning that approximately 12 ammonia FPSOs would be needed to match the output of a single large oil unit. Similarly, the energy conversion efficiency of blue ammonia synthesis (56–66%) is much lower than that of LNG liquefaction (~95%), due to the additional steps of chemical conversion and the energy penalty from carbon capture and storage (CCS).
These factors have critical implications for scalability, layout, and economic feasibility:
Lower energy return on input: Ammonia FPSOs are conceptually attractive for low-carbon energy transport, but their energy efficiency is substantially lower than conventional floaters.
High number of units required: Matching conventional energy flows would require a large fleet of ammonia FPSOs, making large-scale deployment both economically and logistically challenging.
Significant energy penalty: Blue ammonia production is notably less efficient than LNG, reducing its competitiveness in offshore applications.
Despite these challenges, ammonia FPSOs may still play a strategic role in the future offshore energy mix—particularly in niche applications, hybrid configurations, or regions with abundant renewable resources and strong policy support. However, scaling up their deployment will require major advances in process efficiency, system integration, and offshore power infrastructure.
In the next article, we’ll examine the economic realities and market conditions that could enable ammonia FPSOs to move from concept to commercial reality.
References
ABS. (2024). ABS gives green light to SHI’s new ammonia FPSO design. Offshore Energy.
MODEC. (2025). Obtained an Approval in Principle (AiP) by ABS for Blue Ammonia FPSO.
SBM Offshore. (2025). ABS approves blue ammonia FPSO concept from SBM Offshore.
Wison New Energies & H2Carrier. (2025). Partners Collaborate on Green Ammonia FPSO.
Smith, C., & Torrente-Murciano, L. (2025). Cost efficiency versus energy utilization in green ammonia production.
Biswas, S. et al. (2025). A Comprehensive Costing and Emissions Analysis of Blue, Green, and Combined Blue-Green Ammonia Production.
Ammonia Energy Association. (2023). New vessel concepts for offshore production, storage & transport of ammonia.
Ammonia FPSO & Green/Blue Ammonia Production
Smith, C., & Torrente-Murciano, L. (2025). Cost efficiency versus energy utilization in green ammonia production from intermittent renewable energy. Nature Chemical Engineering, 1(2), 1–15. https://doi.org/10.1038/s44286-025-00207-9
Ammonia Production Energy Efficiency:
Tavares, F. V., Monteiro, L. P. C., & Mainier, F. B. (2013). Indicators of energy efficiency in ammonia production plants. American Journal of Engineering Research, 2(7), 116–123. https://www.ajer.org/papers/v2(7)/N027116123.pdf
Blue Ammonia FPSO Industry Concept:
MODEC, Inc., & Toyo Engineering Corporation. (2025). Obtained an Approval in Principle (AiP) by ABS for Blue Ammonia FPSO. https://www.modec.com/news/assets/pdf/20250130_pr_AmmoniaFPSO_en.pdf
Ammonia as an Energy Carrier (Review):
Hasan, M. H., Mahlia, T. M. I., Mofijur, M., Fattah, I. M. R., Handayani, F., Ong, H. C., & Silitonga, A. S. (2021). A comprehensive review on the recent development of ammonia as a renewable energy carrier. Energies, 14(13), 3732. https://doi.org/10.3390/en14133732
FLNG Energy Calculations and Industry Data:
Bhattacharyya, N., Samad, N., Tan, Y. P., & Lim, W. H. (2017). Dynamic simulation and control of a floating liquefied natural gas (FLNG) production facility. Computers & Chemical Engineering, 105, 103–118. https://doi.org/10.1016/j.compchemeng.2017.04.012
Oil FPSO Energy and Emissions Baseline:
OpenWater Energy. (2022). Decarbonising Floating Oil & Gas Facilities – FPSO. OpenWater Energy Newsletter, January 2022. https://www.openwaterenergy.com/wp-content/uploads/2025/01/OWE1901-TN01-A3-January-Newsletter.pdf
General Review on Ammonia for Power and Energy Storage:
Valera-Medina, A., Xiao, H., Owen-Jones, M., David, W. I. F., & Bowen, P. J. (2018). Ammonia for power: A literature review. Progress in Energy and Combustion Science, 69, 63–102. https://doi.org/10.1016/j.pecs.2018.07.001