
AMMONIA FPSO: The Economics Behind the Concept
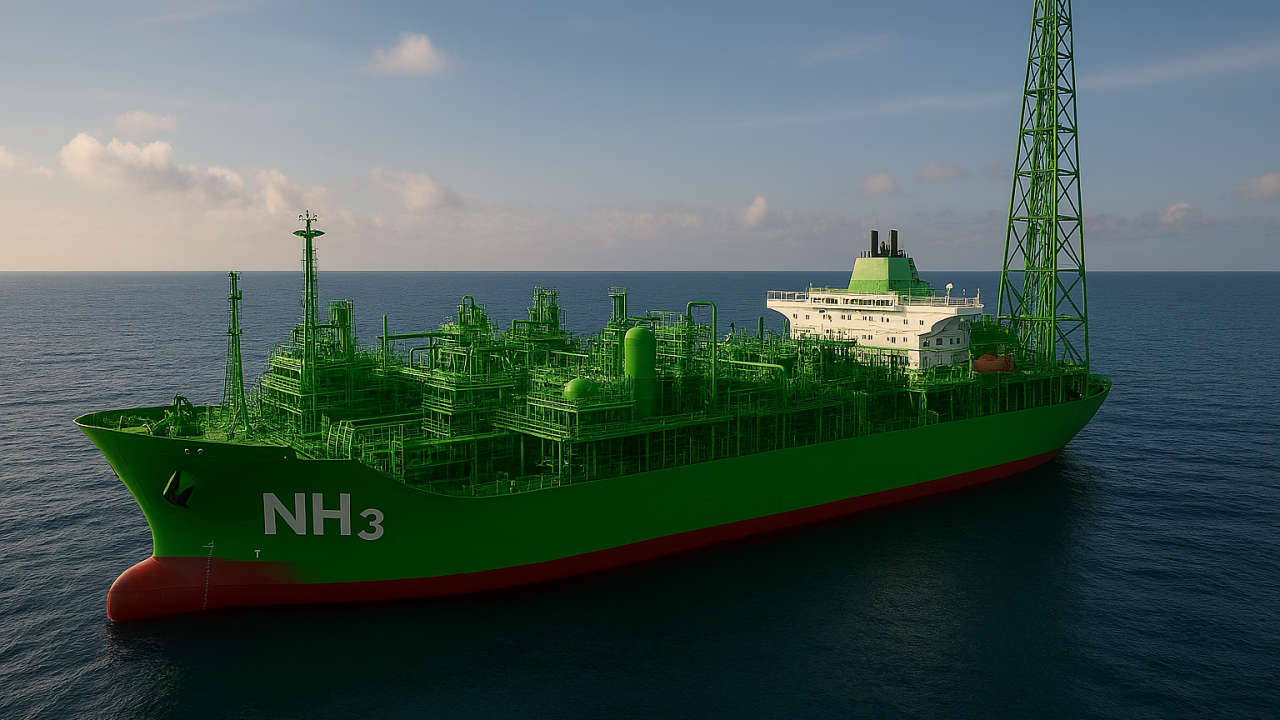
Ammonia FPSOs have captured industry attention as a potential enabler for offshore decarbonization and energy transport. While the first article in this series explored the technical foundations, this second installment addresses the economic dimension: Can these floating plants compete with traditional oil FPSOs or FLNG units? What are the cost drivers, and under what conditions do they make sense?
Economics foundation
The promise (and project objectives) of ammonia FPSOs lies in their ability to monetize stranded gas or integrate with offshore renewables to produce low-carbon fuels. However, the economics are challenging because:
Energy density gap: A 1 MTPA ammonia FPSO delivers only ~0.6 GW of energy in product—about one-tenth of a 100 kbpd oil FPSO (≈6.9 GW). Matching one oil FPSO would require ~12 ammonia FPSOs.
High conversion energy: Unlike LNG liquefaction (≈280 kWh/t), ammonia synthesis requires chemical conversion (SMR + CCS or electrolysis), making it 30× more energy-intensive than LNG.
Cost Structure Overview
The table below highlights that while FPSO, FLNG, and Ammonia FPSO projects all fall in the $1–4 billion range for large units, ammonia FPSOs deliver much lower energy throughput per dollar invested. For example, a 1.2 MTPA blue ammonia FPSO is comparable in absolute CAPEX to a 100,000 bbl/d oil FPSO, but delivers only about one-tenth the energy. FLNG units, while similar in cost, are more efficient in terms of energy processed per dollar due to the lower complexity of LNG liquefaction compared to ammonia synthesis.
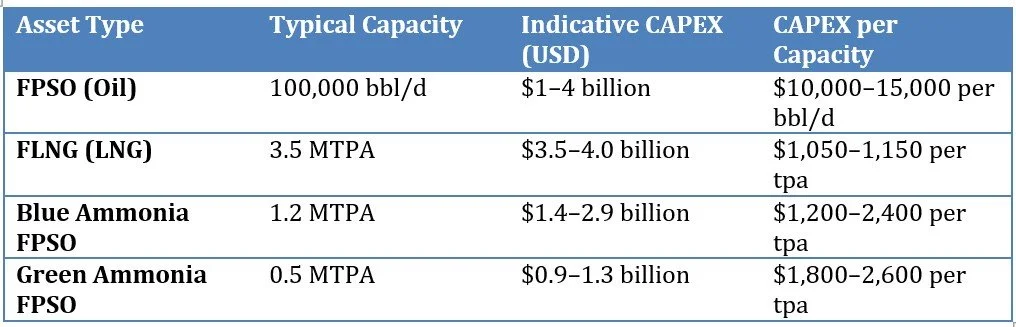
CAPEX Comparison: FPSO, FLNG, and Ammonia FPSO
Hypothesys used for the cost comparison:
Blue Ammonia FPSO
Feedstock: Natural gas (≈31 GJ/t NH₃)
Energy penalty: CCS adds 10–15% extra energy
CAPEX intensity: $1,200–2,400 per tpa (offshore premium)
OPEX: CCS costs ($30/t CO₂ captured) + utilities
Indicative LCOA (Levelized cost of CO2 avoided): $540–790/t at $5–13/GJ gas
Green Ammonia FPSO
Feedstock: Renewable electricity (≈8.4–10.5 MWh/t NH₃)
CAPEX intensity: $1,800–2,600 per tpa (electrolyzer-heavy)
OPEX: Dominated by power cost
Indicative LCOA: $630–1,100/t at $30–80/MWh electricity
Sensitivity Drivers
Blue ammonia: Gas price is the main lever; every $1/GJ shifts LCOA by ~$30/t.
Green ammonia: Electricity dominates; every $10/MWh changes LCOA by ~$95/t.
Carbon pricing: Residual emissions (0.18 tCO₂/t NH₃) add $12–28/t at EU ETS levels (€60–145/t).
Market Context
Blue ammonia CFR Asia: ~$460/t (Aug 2024)
Green ammonia: ~$900–1,050/t delivered under current power and capex assumptions
EU ETS: ~€75–80/t CO₂ (Sept 2025)
TTF gas: ~€32–34/MWh (~$9–10/GJ)
Where Ammonia FPSOs Make Sense
Where Ammonia FPSOs Make Sense
Blue FPSOs: Monetizing associated gas near CO₂ storage hubs (e.g., North Sea, West Africa)
Green FPSOs: Regions with firm renewable power ≤$40/MWh or strong policy incentives (CfDs, tax credits)
Hybrid concepts: Combining SMR and electrolysis to balance intermittency and cost
Some strategic Implications could reduce the CAPEX of these vessels:
Standardization: Modular hulls and topsides to reduce CAPEX
Technology bets: SOEC for green ammonia (cut power by 15–25%); advanced CCS for blue
Policy leverage: Carbon credits, green fuel mandates, and shipping decarbonization targets
Conclusion
Ammonia FPSOs are technically feasible but economically constrained. Blue ammonia can compete today in niche scenarios with cheap gas and nearby CO₂ storage. Green ammonia remains a power-price play, requiring ultra-low-cost electricity or strong policy support. For now, ammonia FPSOs are unlikely to replace oil FPSOs or FLNG in terms of energy throughput, but they could carve out a role in low-carbon shipping fuel supply chains and stranded gas monetization.
References
1. Bhattacharyya, N., Samad, N., Tan, Y. P., & Lim, W. H. (2017). Dynamic simulation and control of a floating liquefied natural gas (FLNG) production facility. Computers & Chemical Engineering, 105, 103–118. https://doi.org/10.1016/j.compchemeng.2017.04.012
2. Hasan, M. H., Mahlia, T. M. I., Mofijur, M., Fattah, I. M. R., Handayani, F., Ong, H. C., & Silitonga, A. S. (2021). A comprehensive review on the recent development of ammonia as a renewable energy carrier. Energies, 14(13), 3732. https://doi.org/10.3390/en14133732
3. Smith, C., & Torrente-Murciano, L. (2025). Cost efficiency versus energy utilization in green ammonia production. Nature Chemical Engineering, 1(2), 1–15. https://doi.org/10.1038/s44286-025-00207-9
4. Tavares, F. V., Monteiro, L. P. C., & Mainier, F. B. (2013). Indicators of energy efficiency in ammonia production plants. American Journal of Engineering Research, 2(7), 116–123.
5. Valera-Medina, A., Xiao, H., Owen-Jones, M., David, W. I. F., & Bowen, P. J. (2018). Ammonia for power: A literature review. Progress in Energy and Combustion Science, 69, 63–102. https://doi.org/10.1016/j.pecs.2018.07.001
6. MODEC, Inc., & Toyo Engineering Corporation. (2025). Obtained an Approval in Principle (AiP) by ABS for Blue Ammonia FPSO. https://www.modec.com/news/assets/pdf/20250130_pr_AmmoniaFPSO_en.pdf
7. ABS. (2024). ABS gives green light to SHI’s new ammonia FPSO design. Offshore Energy.
8. Wison New Energies & H2Carrier. (2025). Partners Collaborate on Green Ammonia FPSO.
